Weird Negative Float Situations – Part 1
Most of us understand that negative float is generated by a constraint that is not being “satisfied” and indeed, we cannot have negative float without a constraint. Or so it would seem. But during a recent training session at the Kennedy Space Center my client showed me several Level of Effort activities that had negative float. In fact, all of the Level of Efforts had negative float yet no other activity showed any negative float whatsoever. Imagine that; the activities linked to the Level of Efforts have positive float but the Level of Efforts have negative float!
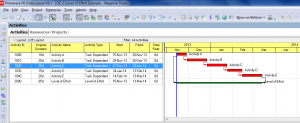
In the first figure I am showing a typical setup with a Level of Effort activity linked to one predecessor and one successor. The Activity Type is shown in the Activity Table to make it easier to see which activity is the Level of Effort:
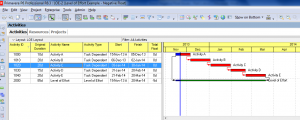
Okay, so far nothing is amiss. The Level of Effort is linked to activities on the critical path and therefore shares the same zero (0) float. But watch what happens when the predecessor to the Level of Effort is updated with progress:
The Level of Effort activity – and only the Level of Effort – has negative float! Keep in mind that no constraints are being used in this schedule. And while all of the Task Dependent activities are on the critical path I can assure you this has nothing to do with the negative float on the Level of Effort activity.
So how is this possible?
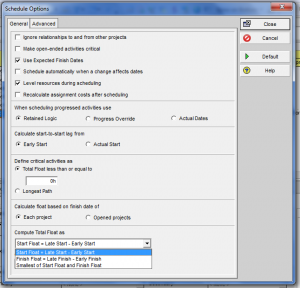
The answer has to do with the ability in Primavera P6 to calculate float three (3) different ways. These settings appear under Schedule Options:
I typically calculate float as the difference between the Late Finish and the Early Finish dates. But my client had selected Late Start – Early Start. (The third option is to take the smallest value of the two calculations). Choosing any setting other than Late Finish – Early Finish will generate negative float once the predecessor to the Level of Effort has started. Moreover, astute viewers will notice that the negative float matches the number of days that have elapsed since the predecessor started. The predecessor started five work days before the Data Date and the float is -5 work days.
Why this is happening is a little hard to explain, but Primavera P6 calculates float for both the start and finish of every task. Normally this results in the same value. Level of Effort activities, however, are another matter. Primavera P6 calculates the float on this type of activity as the difference between the Actual Start Date and the Data Date and perceives the activity as being “late” because the Data Date is later than the Actual Start Date.
Thankfully this weird float issue can be easily avoided by using Late Finish – Early Finish for the float calculations. And while this has always been my personal preference I have a whole new appreciation of this setting now.


Recent Comments